| User Guide |
ApolloRNA 1.11.3a (February 17, 2010) provides some extensions for
Apollo 1.11.3 related to non
protein coding RNA identification:
The RNA menu is automatically enabled when required external softwares are launchable on the computer.
Secondary structure prediction (first item) is activated if RNAfold (Vienna RNA package) and convert (ImageMagick) are launchable.
RNA/RNA interaction search (second item) is actived if RNAfold and RNAeval (Vienna RNA package) are launchable.
Go to Download page of ApolloRNA web site, for a detail download and install protocol of these softwares.
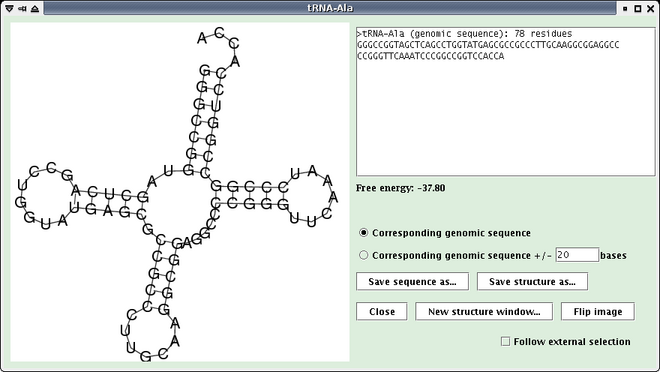
This extension allows the computing and the visualization of the secondary structure of a subsequence, predicted with RNAfold. The user can save it in a image file. convert program of ImageMagick is used to translate the image generated by RNAfold to GIF format image and to flip the image. Note that this functionality is not available if no sequence is loaded in Apollo or if the length of the selected sequence is higher than 1 500 nt.
Select a feature or a sequence, open RNA menu and select "Secondary structure compute...". A window opens (see below). The free energy of the predicted structure is displayed on the right. Note that if more than one sequence are selected, only the structure of the first sequence is computed.
- Check the "Corresponding genomic sequence +/- x bases" checkbox and put a x value in the textfield, and the corresponding sequence and structure will be computed and displayed in the same window.
- Click the "Save structure as..." button to save the currently displayed image as GIF file.
- Click the "Save sequence as..." button to save the currently displayed sequence(s) as a multiple-FASTA file.
- Check the "Follow external selection" checkbox and the window will follow selections made in the main Apollo window.
- Click the "New structure window..." button to launch a new structure window from the current one.
- Click the "Flip image" button to flip image in the vertical direction.
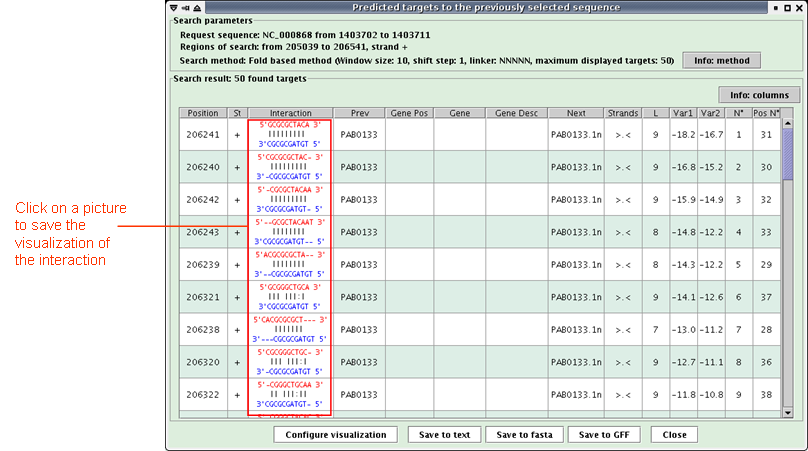
A request sequence is defined and research genomic regions are scanned to find potential RNA targets of the request sequence. Note that this functionality is not available if no sequence is loaded in Apollo or if the "Reverse complement" option is checked.
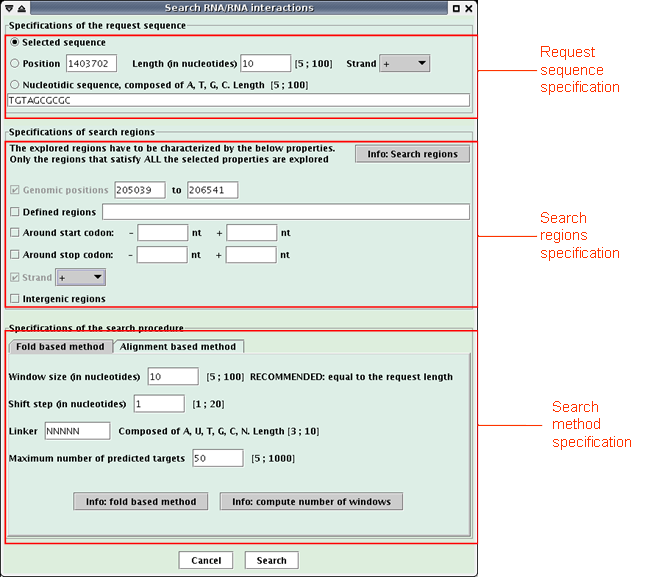


When the research is achieved, a new window opens (see below) with a table listing the predicted targets of the request sequence.
The table presents one target per line with the following description of each column:Click the "Save to text" button to save the interactions in a text file.Position: low genomic position,
St: strand,
Interaction: interaction visualization, (The target is painting in red, the request sequence in blue)
Clicking on the picture opens a new window to better see the interaction,
Prev: preceeding gene and its distance with overlapping gene(s),
Gene Pos: low genomic position of overlapping gene(s),
Gene: overlapping gene(s),
Gene Desc: description of overlapping gene(s) product, and in parentheses the related comments when the product is an hypothetical protein. In a Genbank file, the gene product is contained in its qualifier "/product" and the related comments in the qualifier "/Note".
Next: following gene and its distance with overlapping gene(s),
Strands: respectively, strands of the previous gene, overlapping gene(s) and the next gene, ('>' for strand +, '<' for strand - and '.' when no value)
L: length of the interaction,
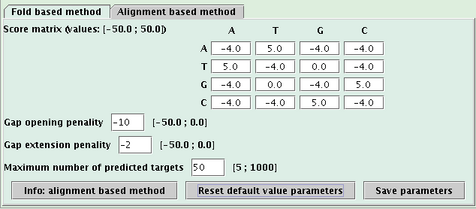
Var1: main variable of the search method (the one of the fold based method is the interaction free energy computed by RNAeval, the one of the alignment based method is the score of the alignment),
Var2: secondary variable of the search method (the one of the fold based method is the RNAfold free energy),
N°: order number according to the search method,
Pos N°: order number according to the genomic position.
Click the "Save to fasta" button to save the target sequences in a multiple-fasta file.
Click the "Save to GFF" button to save the targets in a GFF file.
Click on an interaction picture: a new window opens (see below). Click the "Save image as..." button to save the interaction visualization as a PNG file.
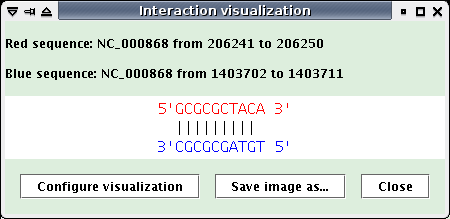
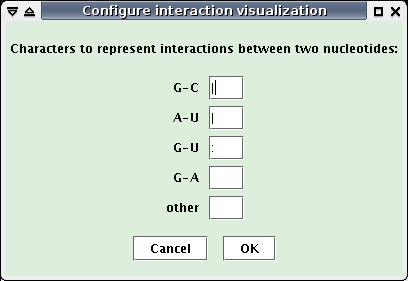
The two previous windows contain a "Configure visualization" button, that allows to modify the characters linking two paired nucleotides in the visualization.
- Click this button.
- In the new opened window (see below), change characters and click the "OK" button: the interaction visualizations are updated using the new characters.
Apollo users could only display the graph of "GC%" variable on a sliding window. This extension allows the visualization of up to five additional graphs on Apollo's main window. These graphs could be based on internal computed values or from other software outputs.
- Open the Analysis menu and select "Show quantitative variable...".
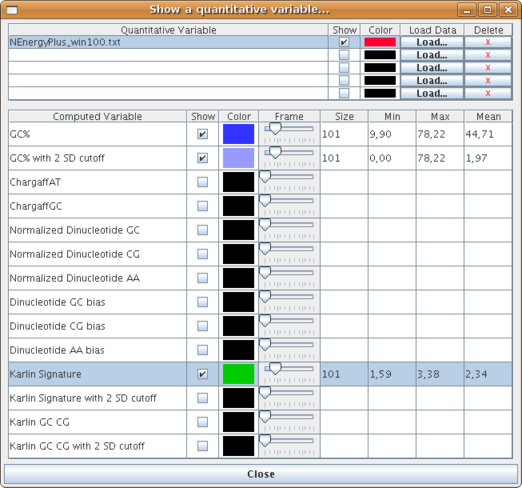
A new window dedicated for quantitative variables visualization opens (see below).
The window is composed of two tables. .
The first one is used to load external data. For each graph to be shown, there are five fields:Note that you can only fill the table incrementally (from the top position to the bottom one). Then all actions (change color, delete or hide/show) are disabled until data is loaded and graph is created.Quantitative Variable: name of the loaded file that contains the variable values.
Show: checkbox used to show or hide the graph when it is created.
Color: current graph color. You can change the color of the graph by clicking on it.
Load Data: button that lets you choose a file to be loaded. It also creates a new graph and make it visible.
Delete: button used to remove a graph from the current visualisation.
The second table lets users to visualize computed sequence composition variables graphs. Its behaviour is quite similar from the table above. Each row has eigth fields.
The first three of them are similar than previously, the only difference is that the variables names are fixed. A computed variable can only be set with the help of a reading frame, which determines an area where calculation will be made for a particular position. Fields named Frame and Size are two different ways to set the size of the sliding window. You can make the slider move to a specific size or input this size directly in the next field of the row. Changes are automatically reported to the visualisation panel (Beware that it is sometimes necessary to growth zoom to be able to see the graph, depending on the size of the overall sequence).
The last three fields indicate the mean, min and max values of the corresponding variable.
This is a view of one loaded variable and one computed one:
This extension allows to get information:on selected sequence(s) and the entire loaded sequence.
- G and C percent,
- number of non A,T,G,C nucleotides,
- intergenic percent,
Select a feature or a sequence, or several ones, open Analysis menu and select "Selected sequence information...". A window opens (see the window below where two tRNAs are selected).
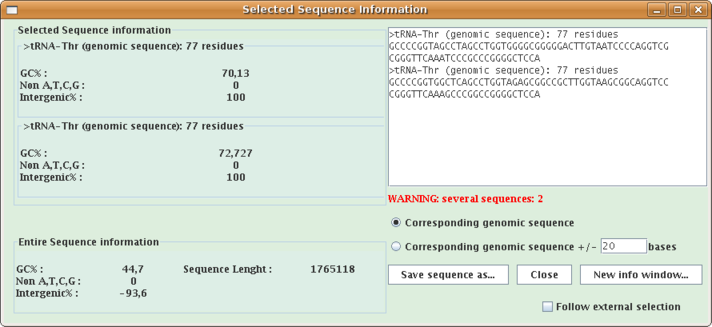
- Check the "Corresponding genomic sequence +/- x bases" checkbox and put a x value in the textfield, and the corresponding sequence and structure will be computed and displayed in the same window.
- Click the "Save sequence as..." button to save the currently displayed sequence(s) as a multiple-FASTA file.
- Click the "New info window..." button to launch a new information window from the current one.
- Check the "Follow external selection" checkbox and the window will follow selections made in the main Apollo window.
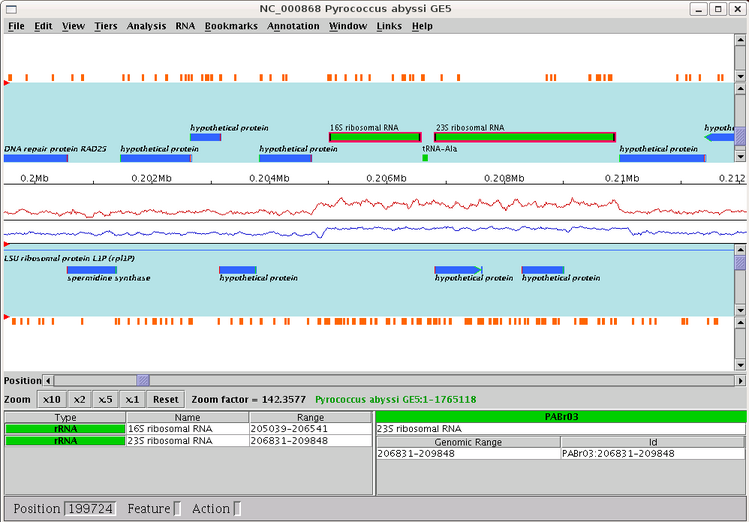
Apollo users could only print in a file the current view of the main Apollo window. This extension allows the export in files of a set of chained views of a subsequence. The user enters the positions of a subsequence, a zoom factor and calls the export: a set of image files is created. The images are ordered, zoomed and chained views of the subsequence.
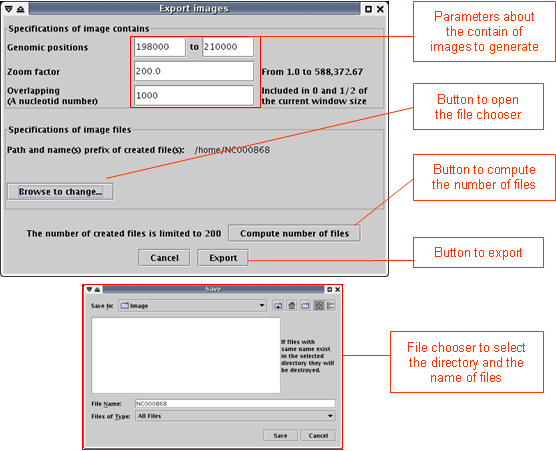
- Open the File menu and select "Export images". (Note that this option is not possible for the synteny). A window opens (see below).
- In the first part of the window, enter parameters of image contain: start and stop positions of the wished genomic subsequence, zoom factor, overlapping between two consecutive images.
- In the second part, using the "Browse to change" button, select the output directory and enter the prefix of the name of resulted files.
- In the third part, click the "Export" button.
Click the "Compute number of files" button to know the number of files, which will be created according to the current parameters.
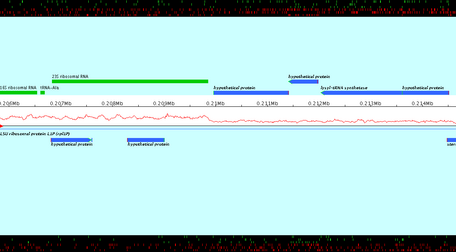
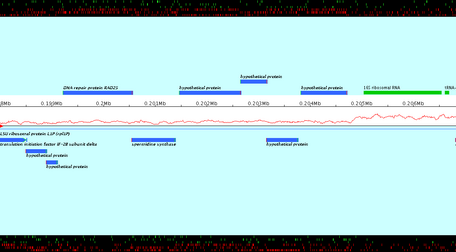
Created images are chained zoomed views of the subsequence which starts and stops at the specified positions. Overlapping value determines the number of nucleotids displayed in both consecutive views. Created images are PNG files ; their name is the entered file name, followed by the character "_" and the number of the view.
The genomic sequence of Pyrococcus abyssi GE5 (1 765118 nt) is loaded in Apollo. The export of a subsequence starting to the position 198 000 and stopping to 210 000, with a zoom factor equals to 200.0, with 1 000 overlapping nucleotids in files whose name is prefixed by "NC000868" is loaded. 2 image files are created: NC000868_1.png and NC000868_2.png (see below). Note that the last image, NC000868_2.png, doesn't finish to the stop position, but "contains" the stop position.
Last update: February 16, 2018.